THE PROBLEM
Imagine the following situation.
You have a microplate reader and people need to book time slots in order to use it.
The microplate reader provides you with dose-response data in Excel format.
In order to fit the data to a sigmoidal curve and plot it, you have bought a license for some fancy proprietary software.
The license is expensive and it is locked to the same PC you are using to collect the data.
Data collection takes only 20 minutes.
However, each user needs to book the machine for several hours in order to process the data.
Most compounds are inactive, so this is a waste of user and machine time.
This happened to us.

THE SOLUTION
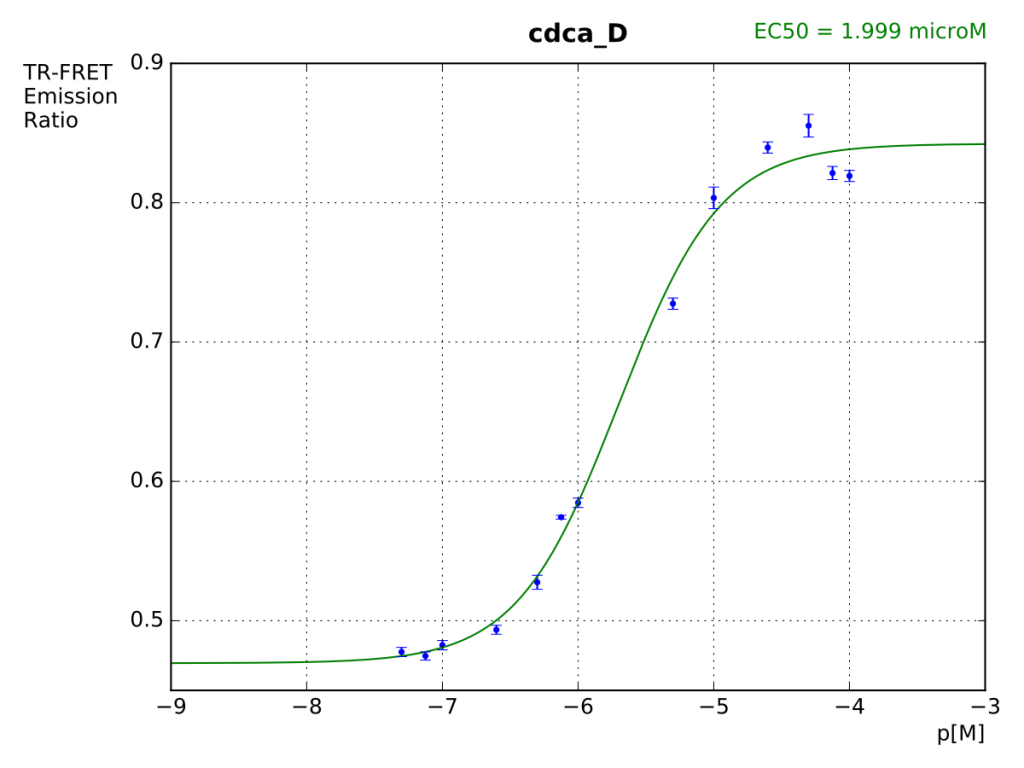
A tiny Python 2 script takes the raw output from the device and in a fraction of a second is able to process dozens of readings.
It outputs plain text CSV files and editable vectorial SVG graphs.
At a simple glance, you know which compounds are active and how active they are.
By using this simple script we saved uncountable hours of user and machine time.
Plus, software licenses became redundant.
